Know exactly how your submission will compare with comparables in the market.
According to a 2021 study that we conducted with our partners at Advisen, 71% of risk managers are dissatisfied with how insurers price their property risk. In turn, 90% of commercial property insurance underwriters reported that higher data quality in property risk submissions helps them to improve pricing accuracy – as per the Q4 2020 Techvalidate Underwriter Survey. While risk managers and brokers agree that it is important to improve data quality with each renewal – it is difficult to know where to start.
“Lack of data forces us to assume the worst, resulting in more conservative pricing.”
– Underwriter, Fortune Global 500 Insurer
The Archipelago Readiness Report addresses this challenge directly. Included in all three of the Archipelago packages, the report empowers risk managers and brokers to better understand exactly how their property risk data quality compares to the market and where they can improve it.
The report is generated on Archipelago shortly after an SOV has been uploaded to the platform. Specifically, the Readiness Report aggregates and organizes COPE (construction, occupancy, protection, exposure) core and secondary attributes and charts the completeness and accuracy of the data within the portfolio. It also showcases the distribution of the data quality by property and TIV and helps maximize improvement efforts by prioritizing the properties with the greatest impact on the pricing of the portfolio.
Based on the full analysis of the portfolio and its benchmarking with hundreds of other comparable portfolios in the market, the Archipelago Readiness Report lists a level of readiness, which is an indicator of current data quality. The readiness level, as well as all other analytics within the report, updates over time as the portfolio is modified and enriched.
Interested in taking a closer look at the Archipelago Readiness Report? Watch the walkthrough video below for a first-hand look and request your 14-day free trial of Archipelago Essentials today.
Video Transcript
Welcome to Archipelago.
This video provides an overview of the Archipelago Readiness Report and is most relevant to property portfolio owners, including risk managers, as well as brokers of commercial property insurance.
Archipelago customers know that the quality of property risk data is important in the submission process–in fact 90% of underwriters agree that high data quality helps them to provide more accurate pricing*. Yet, it can prove challenging to know how to improve portfolio data quality in the most impactful ways.
The Archipelago Readiness Report helps our customers achieve higher data quality in their portfolios and demonstrates how comprehensive, accurate, and consistent data can have a profound impact on insurance outcomes.
Before diving into a sample report, it’s important to point out that this report is included across all Archipelago packages including Archipelago Essentials, Ecosystem, and Intelligence to any individual with Risk Manager level permissions. Even better, individuals taking advantage of the 14-day free trial will also have access to this report.
The Archipelago Readiness Report can be accessed by clicking on the “Reports'' button on the platform. The report is generated from when the first SOV is uploaded and updates over time as the property evolves to be as insightful and relevant as possible. To that point, users can access different versions of the report based on each uploaded SOV.
First, note the top section of the report which contains grade level, benchmark information, and exposure summary.
Readiness Level
The Readiness Report will reflect one of three levels based on the quality of data in the portfolio including core and secondary attributes along with other indications of completeness and accuracy. Level 3 is the highest score and reflects a portfolio with high quality data likely to result in the best possible insurance outcomes in the market. In contrast, level 1 reflects a portfolio most in need of data quality improvements.
A low level reflects a tremendous opportunity to gain insight as to how to elevate the portfolio's market position. Likewise, scoring at levels 2 or 3 reveals significant opportunities to further improve the data quality of the portfolio or maintain excellent standing as the portfolio evolves
Benchmark
The benchmark portion shows data quality relative to thousands of other portfolios. The graph also depicts which of those comparative portfolios have been enriched by Archipelago’s artificial intelligence capabilities shown in green versus those that have yet to experience enrichment visible in gray.
Exposure Summary
The exposure summary will present key information related to hazard exposure and how much of the overall TIV is affected by each hazard including earthquake, wind, flood, and others depending on the portfolio.
Core Attributes Data Quality
In the next section of the report, there is aggregate reporting on known and unknown core attributes such as specific occupancy, square footage, and the year built for each particular property. Having this information is extremely important to how the portfolio is received by the market. For good measure, the report then includes a comparison of this portfolio’s street address and all primary attributes against other portfolios on Archipelago.
Secondary Attributes Data Quality
Positioned vertically on the right portion of the report, there are graphs to reflect the data quality of secondary attributes. This includes views of the top five details related to fire, earthquake, wind, and flood exposures. These details include granular construction information like known roofing material, hazard mitigations like earthquake bracing, and contextual hazard details like first floor elevation.
Data Quality Distribution by Property
In the final section of the report, there is greater detail to how this portfolio achieved the placement grade as indicated in the first section of the report. Given that certain properties reflect disproportionate percentages of TIV, there are two visible distributions showing the placement grade by property–that is the number of properties that achieved a particular score. And below the distribution shows the percentage of TIV that achieved a particular score.
Property Prioritization
The next graph is crucial in that it implies how both owners and brokers prioritize data quality specific to the properties that disproportionately impact placement. In this case, we can see that 10% of the TIV is impacted by just two properties out of the 150 in this portfolio. Moving down the line, 6 properties impact 30% of TIV, and 16 properties represent 50% of TIV. Based on this information, we can conclude that data enrichment in even a small number of key properties can have an enormous impact on how this portfolio is received by underwriting.
We hope that you’ll find the Archipelago Readiness Report insightful, actionable, and empowering as you look to improve portfolio data quality.
For further questions on the Readiness Report, please reach out to your Archipelago representative or request a 14-day Free Trial at onarchipelago.com.
Share this
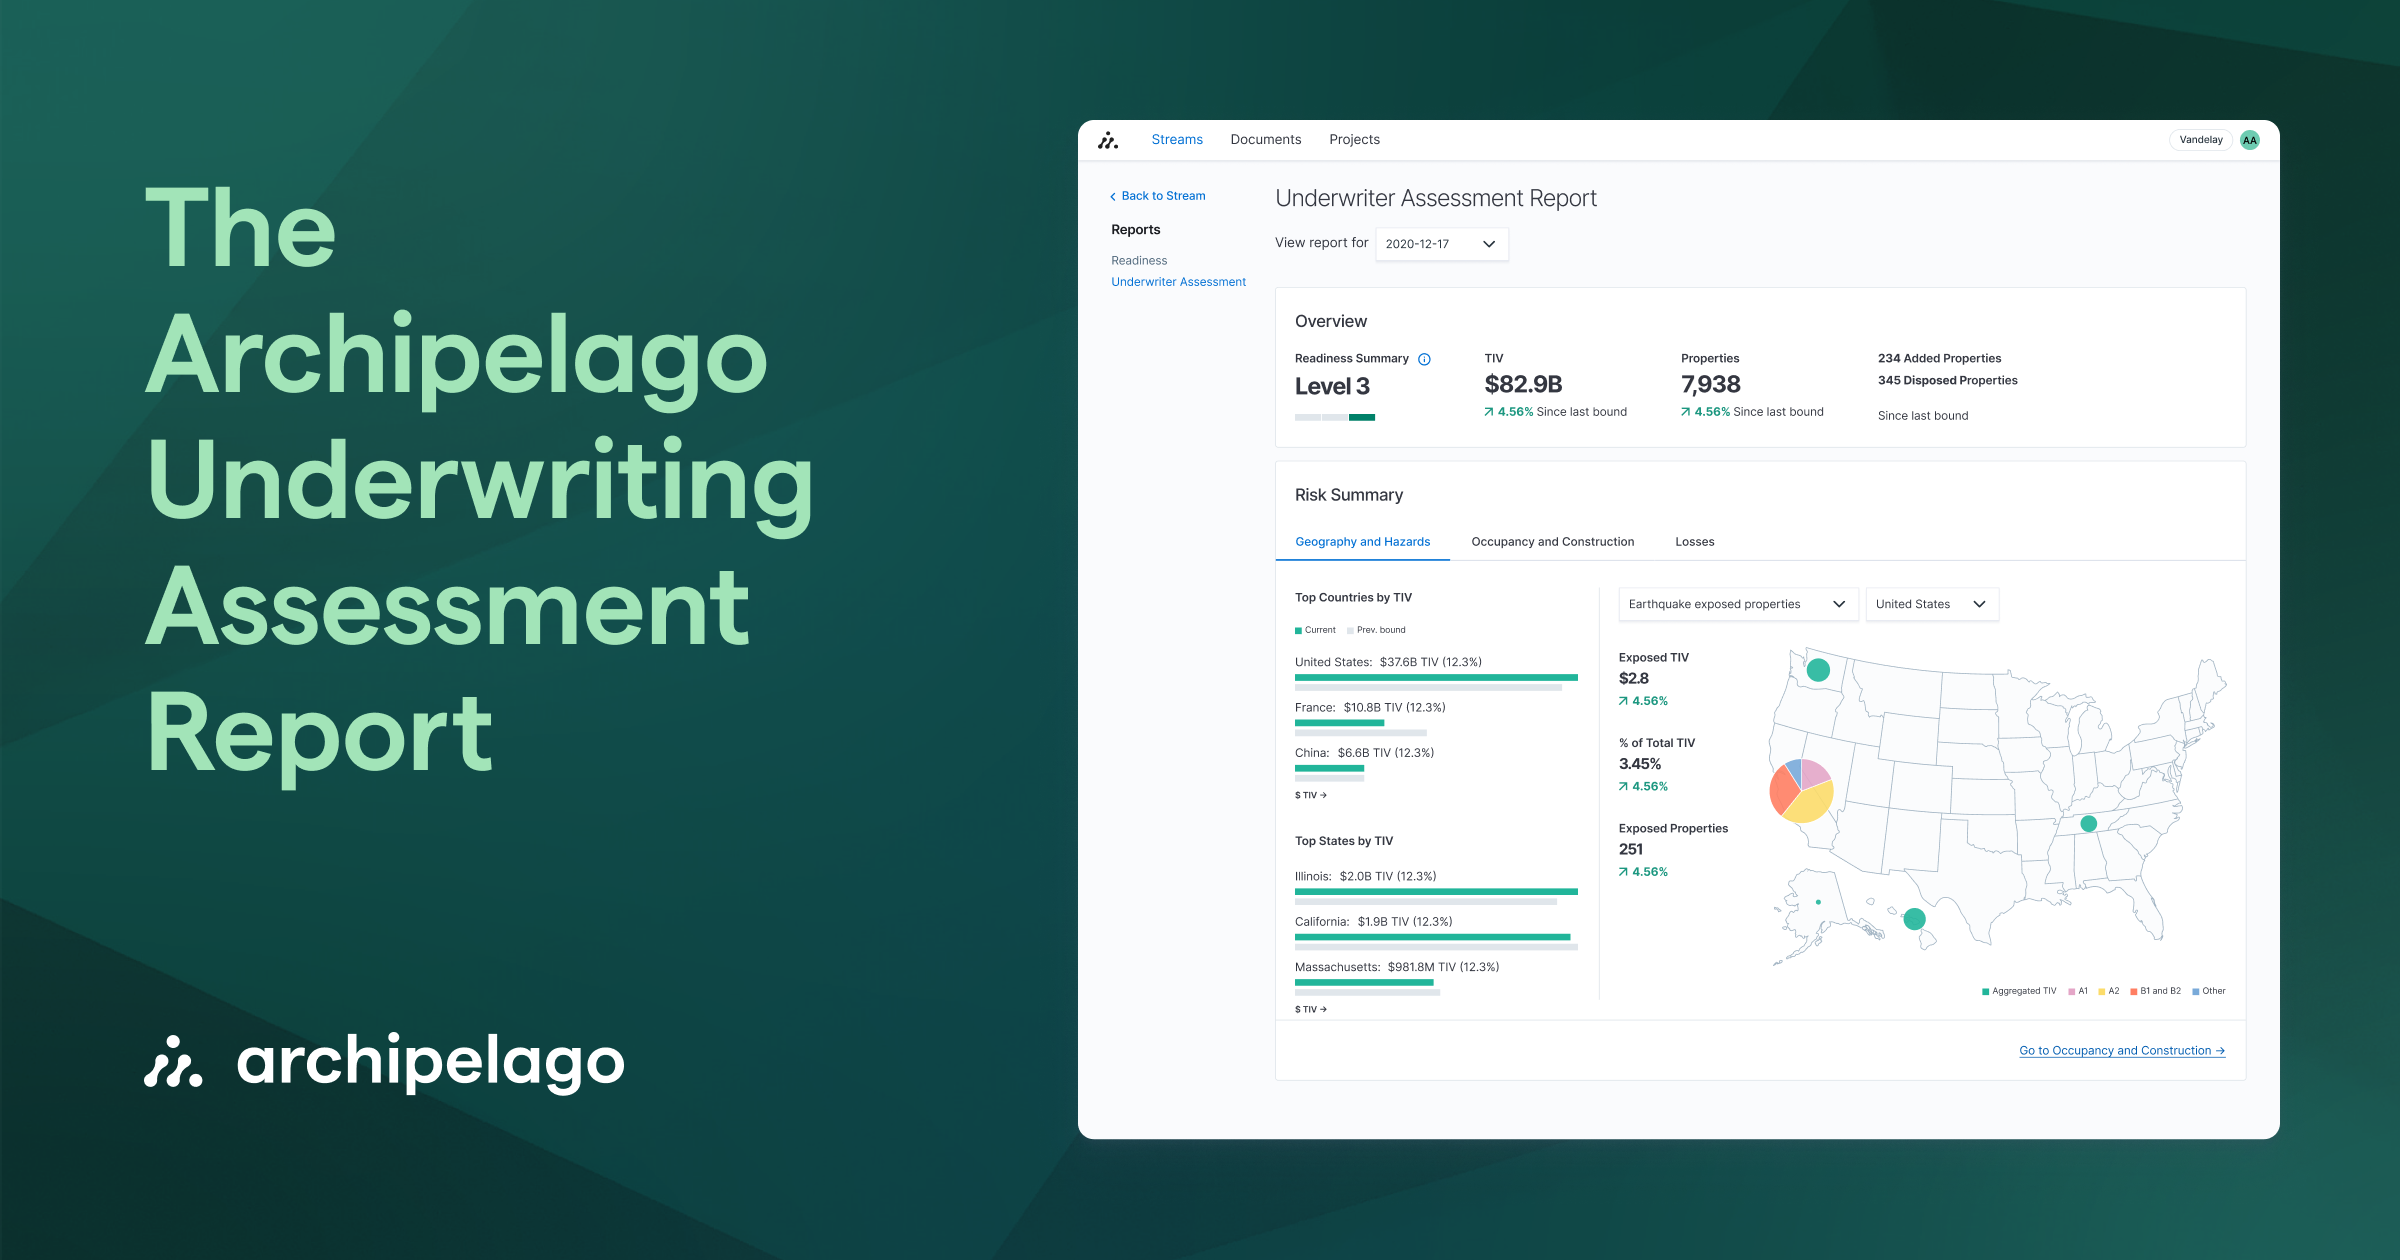
The Archipelago Underwriting Assessment Report
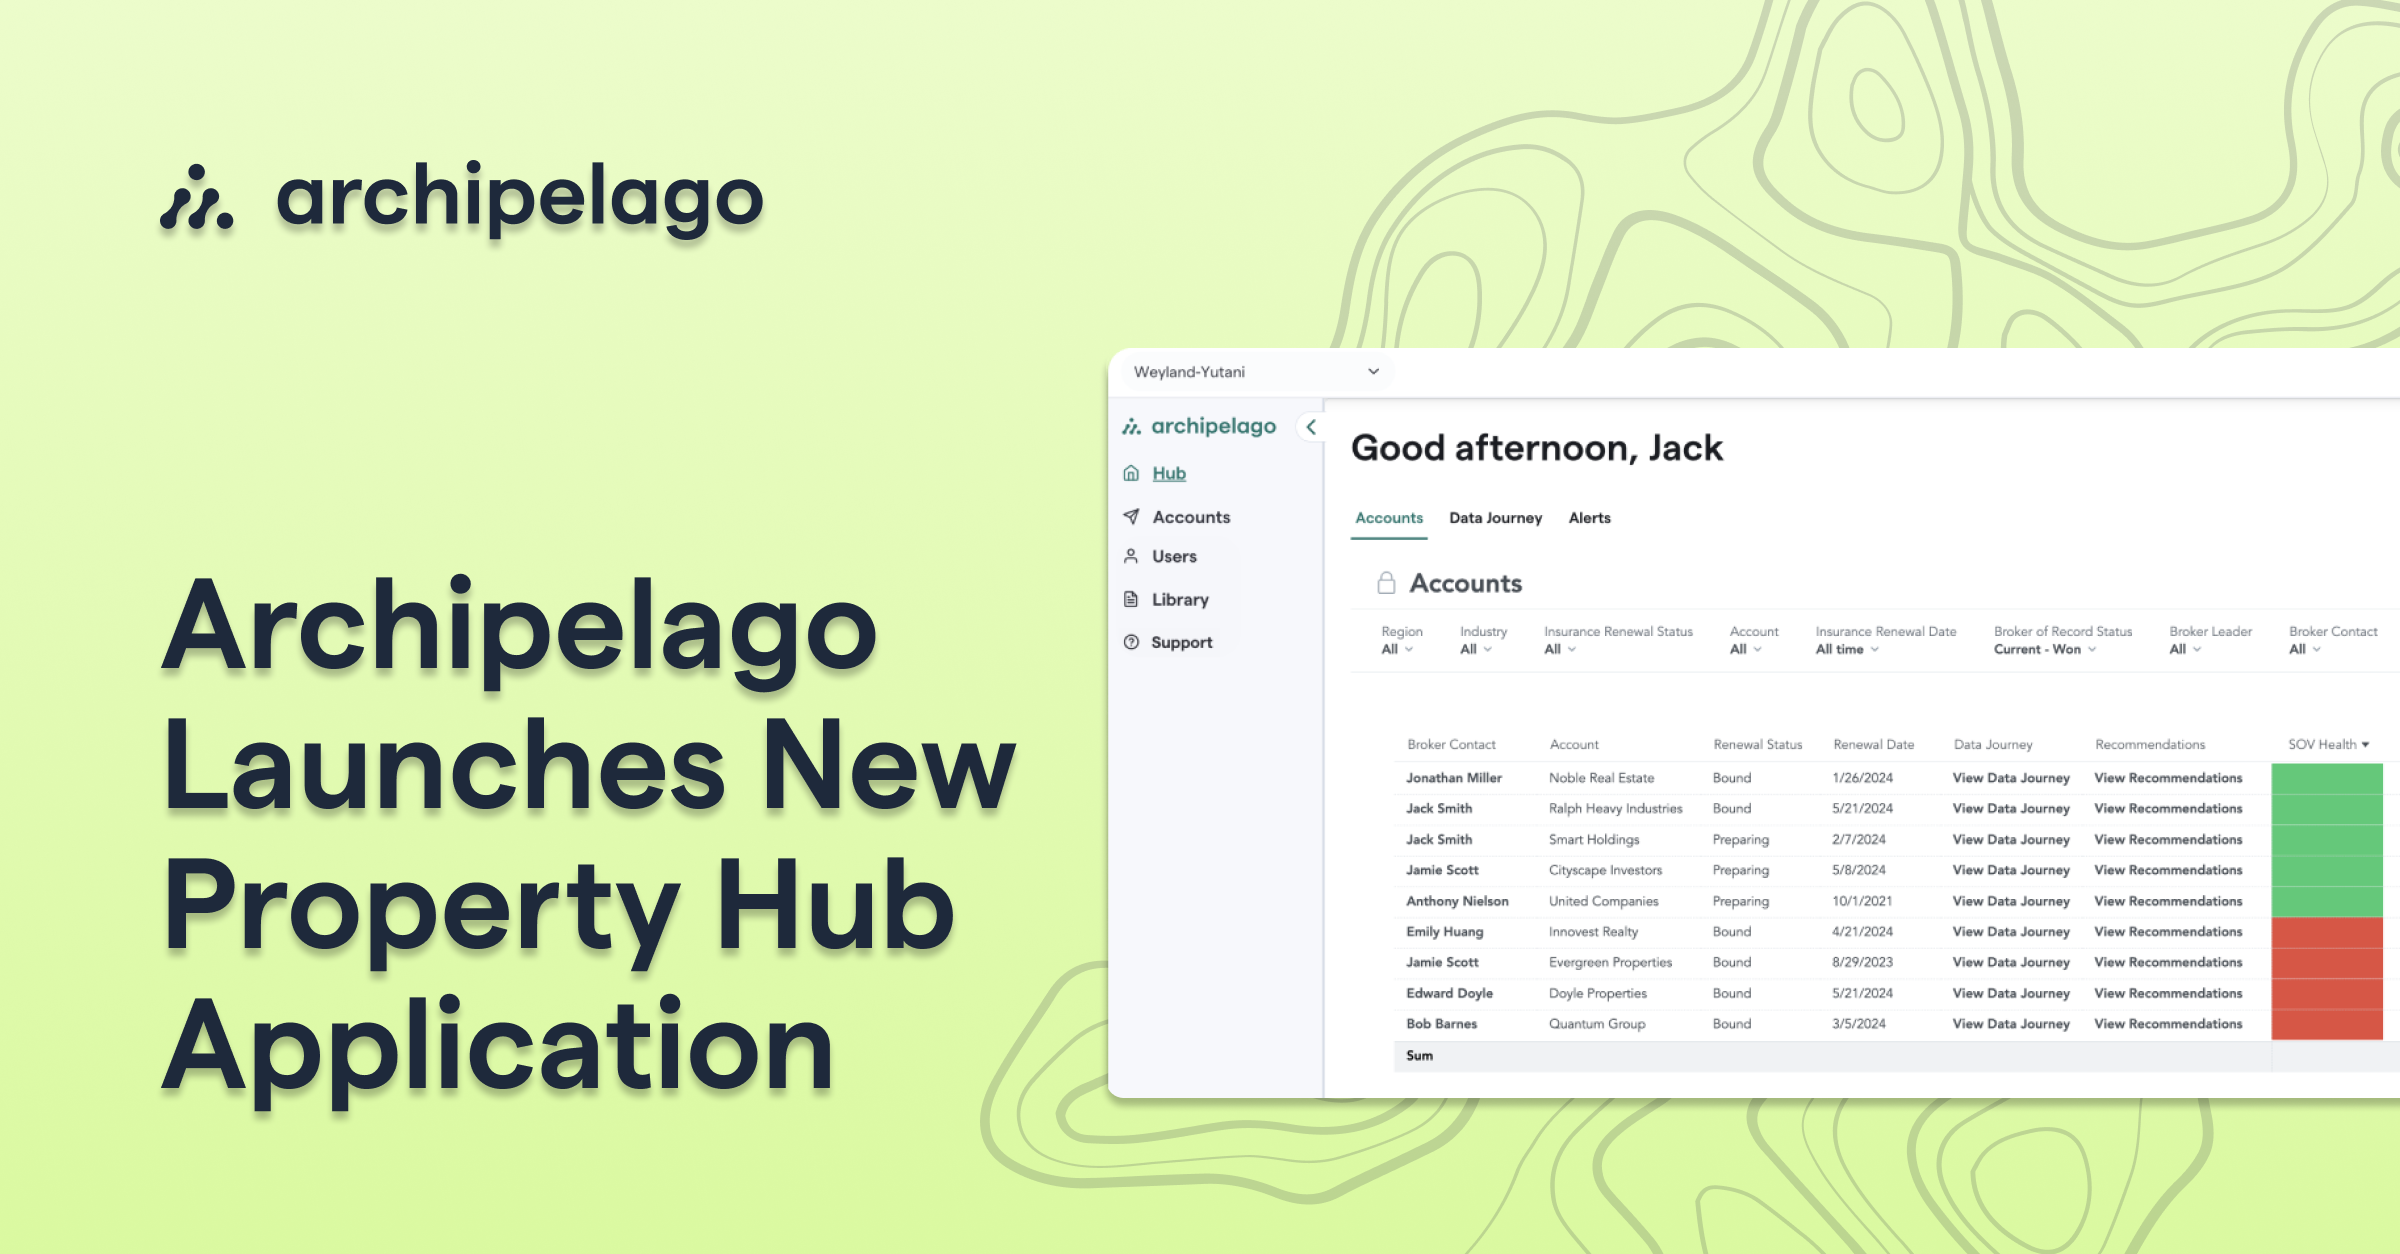
Archipelago Launches AI Tools to Help Broker Leaders Improve How Their Teams Prepare Submissions